The Nifty 50, a key benchmark index in India, is often compared to various global indices to evaluate its performance and investment potential. Here’s how it stacks up against other major indices:
Performance Overview
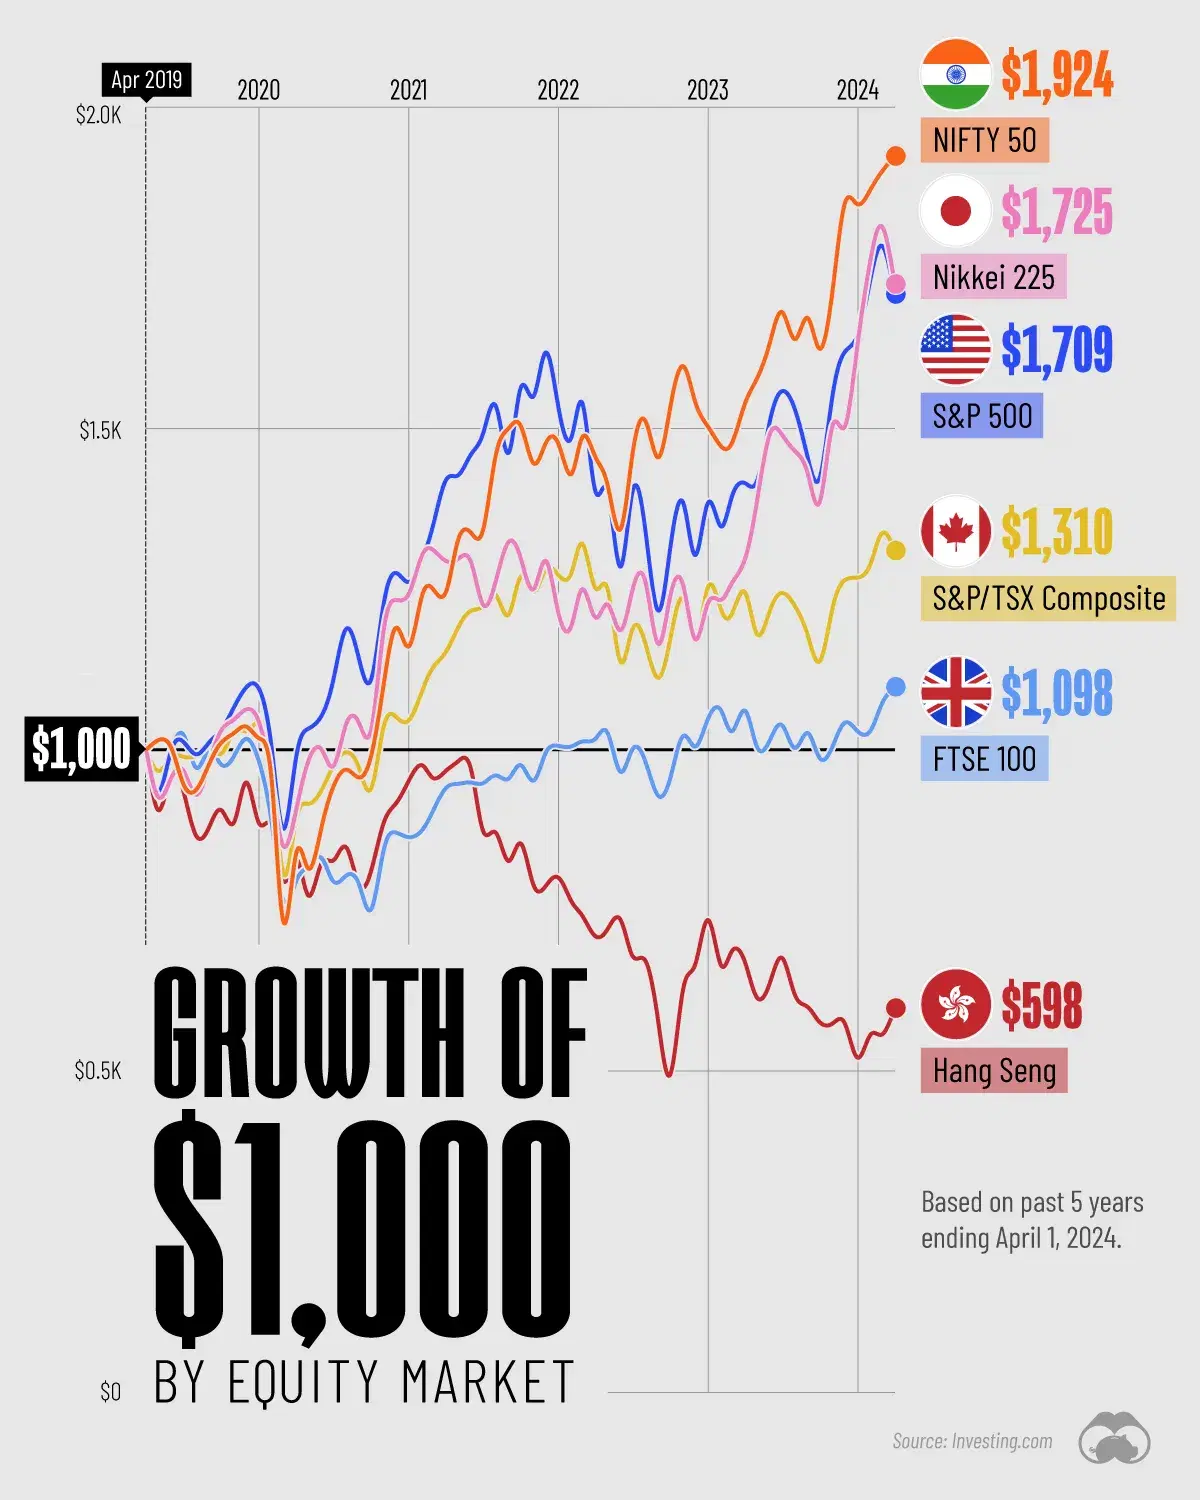
In 5 Years, the Nifty 50 has shown a growth of 129.16%, outperforming the S&P 500 and Nasdaq 100. Over the past year, the Nifty 50 has returned 33.25%, surpassing the S&P 500, Nasdaq 100, MSCI Emerging Markets, and MSCI EAFE. The Nifty 50 has also demonstrated strong performance over the 3-year and 5-year periods.
Recent Trends
- Nifty 50 has shown strong growth over the past year, outperforming the S&P 500 and other indices like the MSCI Emerging Markets and MSCI EAFE [2].
- In terms of monthly performance, the Nifty has increased by 5.61%, while the S&P 500 and Nasdaq have also shown positive returns [1][4].
Long-Term Comparison
According to a study by Motilal Oswal, the Nifty 500, which includes a broader range of stocks than the Nifty 50, has outperformed most global indices over the last decade, only trailing behind the Nasdaq [2]. From December 2013 to December 2023:
- The Nifty 500 returned approximately 16% in Indian Rupee terms.
- The S&P 500 yielded about 15.4%, while the MSCI Emerging Markets and MSCI EAFE returned significantly less at 6.1% and 7.9%, respectively [2].
Valuation Metrics
When comparing price-to-earnings (P/E) ratios, recent analyses indicate that the Nifty may appear pricey compared to some global markets, yet it remains competitive given its growth trajectory [4].
Conclusion
The Nifty 50 demonstrates robust performance relative to other global indices, particularly in terms of annual returns and resilience during market fluctuations. Its strong fundamentals and diverse sector representation make it an attractive option for investors looking to capitalize on India's economic growth narrative.
- Source: Economic Times, Business Standard, IPS Academy, Groww, Moneycontrol